


Gaussian Mixture Model
!date
import arviz as az
import matplotlib.pyplot as plt
import numpy as np
import pandas as pd
import pymc3 as pm
import theano.tensor as tt

print(f"Running on PyMC3 v{pm.__version__}")
Monday 20 September 2021 02:03:03 AM IST
Running on PyMC3 v3.11.2
%config InlineBackend.figure_format = 'retina'
RANDOM_SEED = 8927
rng = np.random.default_rng(RANDOM_SEED)
az.style.use("arviz-darkgrid")
# setup model
model = pm.Model(coords={"cluster": np.arange(k), "obs_id": np.arange(ndata)})
with model:
    # cluster sizes
    p = pm.Dirichlet("p", a=np.array([1.0, 1.0, 1.0]), dims="cluster")
    # ensure all clusters have some points
    p_min_potential = pm.Potential("p_min_potential", tt.switch(tt.min(p) < 0.1, -np.inf, 0))

    # cluster centers
    means = pm.Normal("means", mu=[0, 0, 0], sigma=15, dims="cluster")
    # break symmetry
    order_means_potential = pm.Potential(
        "order_means_potential",
        tt.switch(means[1] - means[0] < 0, -np.inf, 0)
        + tt.switch(means[2] - means[1] < 0, -np.inf, 0),
    )

    # measurement error
    sd = pm.Uniform("sd", lower=0, upper=20)

    # latent cluster of each observation
    category = pm.Categorical("category", p=p, dims="obs_id")

    # likelihood for each observed value
    points = pm.Normal("obs", mu=means[category], sigma=sd, observed=data, dims="obs_id")
# fit model
with model:
    step1 = pm.Metropolis(vars=[p, sd, means])
    step2 = pm.CategoricalGibbsMetropolis(vars=[category])
    trace = pm.sample(20000, step=[step1, step2], tune=5000, return_inferencedata=True)
Multiprocess sampling (4 chains in 4 jobs)
CompoundStep
>CompoundStep
>>Metropolis: [means]
>>Metropolis: [sd]
>>Metropolis: [p]
>CategoricalGibbsMetropolis: [category]
100.00% [100000/100000 59:13<00:00 Sampling 4 chains, 0 divergences]
Sampling 4 chains for 5_000 tune and 20_000 draw iterations (20_000 + 80_000 draws total) took 3554 seconds.
0, dim: obs_id, 500 =? 500
/home/ada/.local/lib/python3.8/site-packages/arviz/stats/diagnostics.py:561: RuntimeWarning: invalid value encountered in double_scalars
  (between_chain_variance / within_chain_variance + num_samples - 1) / (num_samples)
The number of effective samples is smaller than 10% for some parameters.
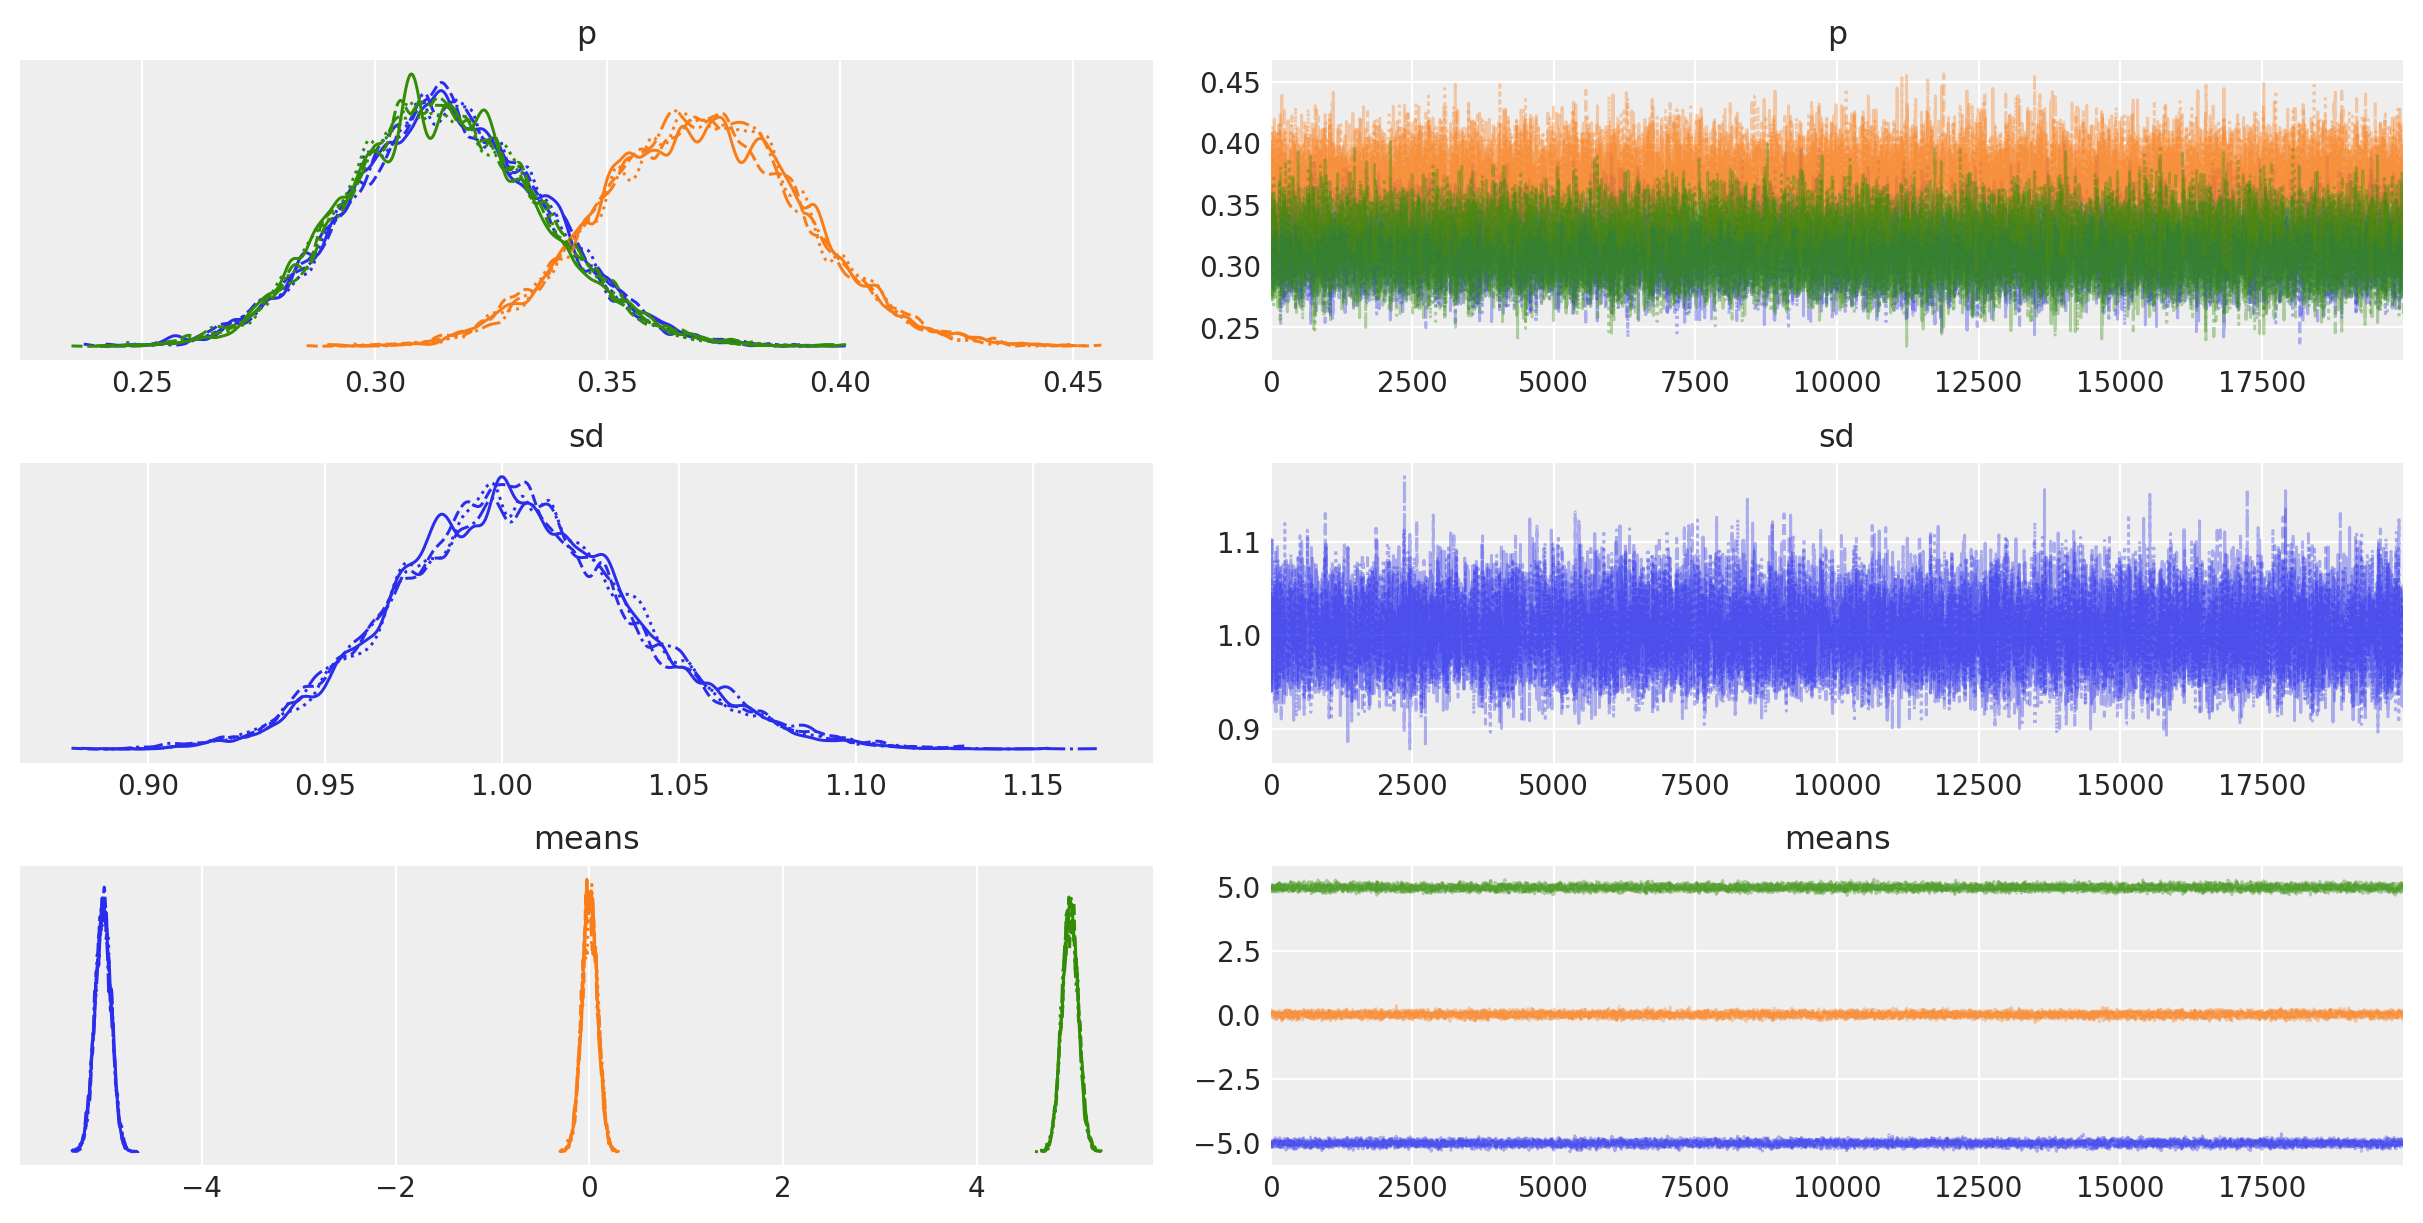
Trace
az.plot_trace(trace, var_names=["p", "sd", "means"]);
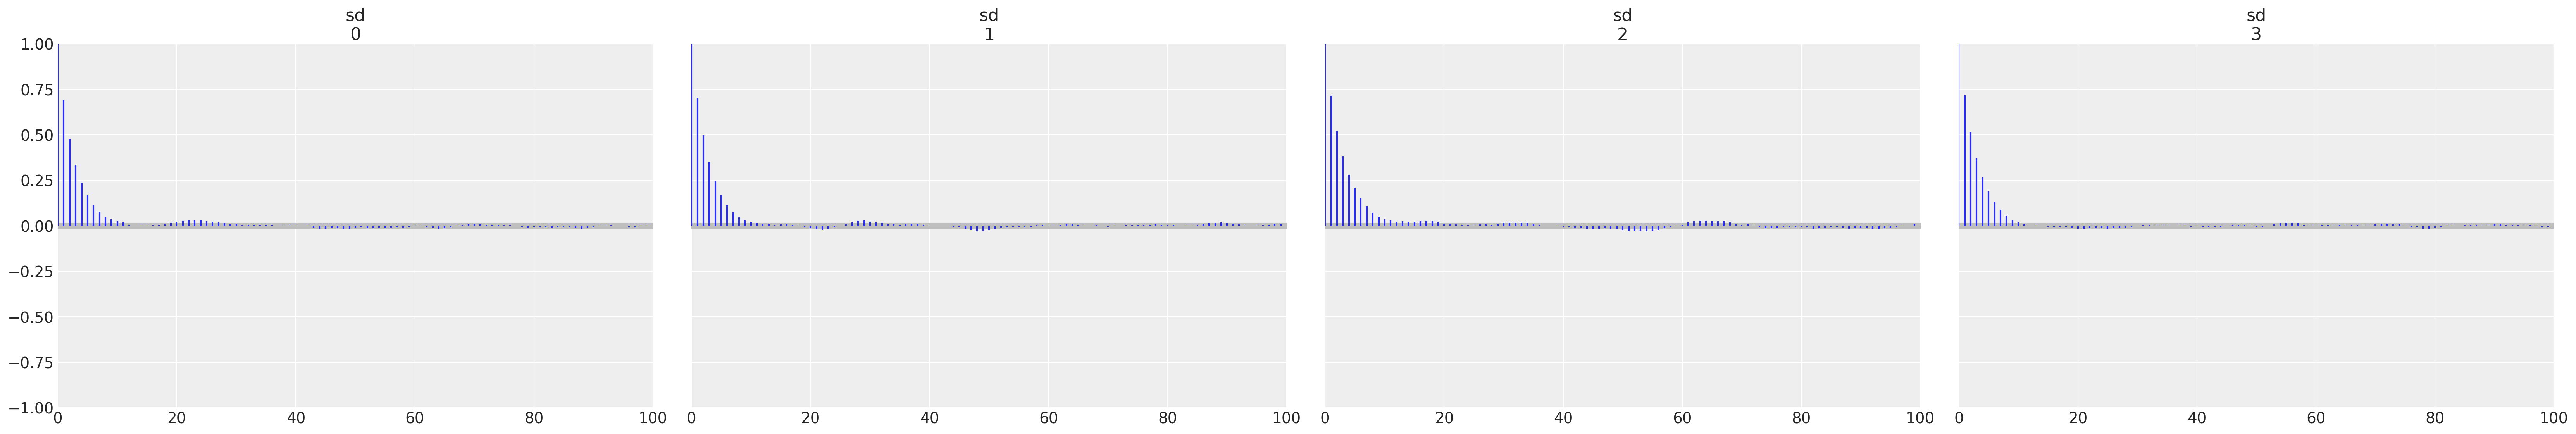
# I prefer autocorrelation plots for serious confirmation of MCMC convergence
az.plot_autocorr(trace, var_names=["sd"]);
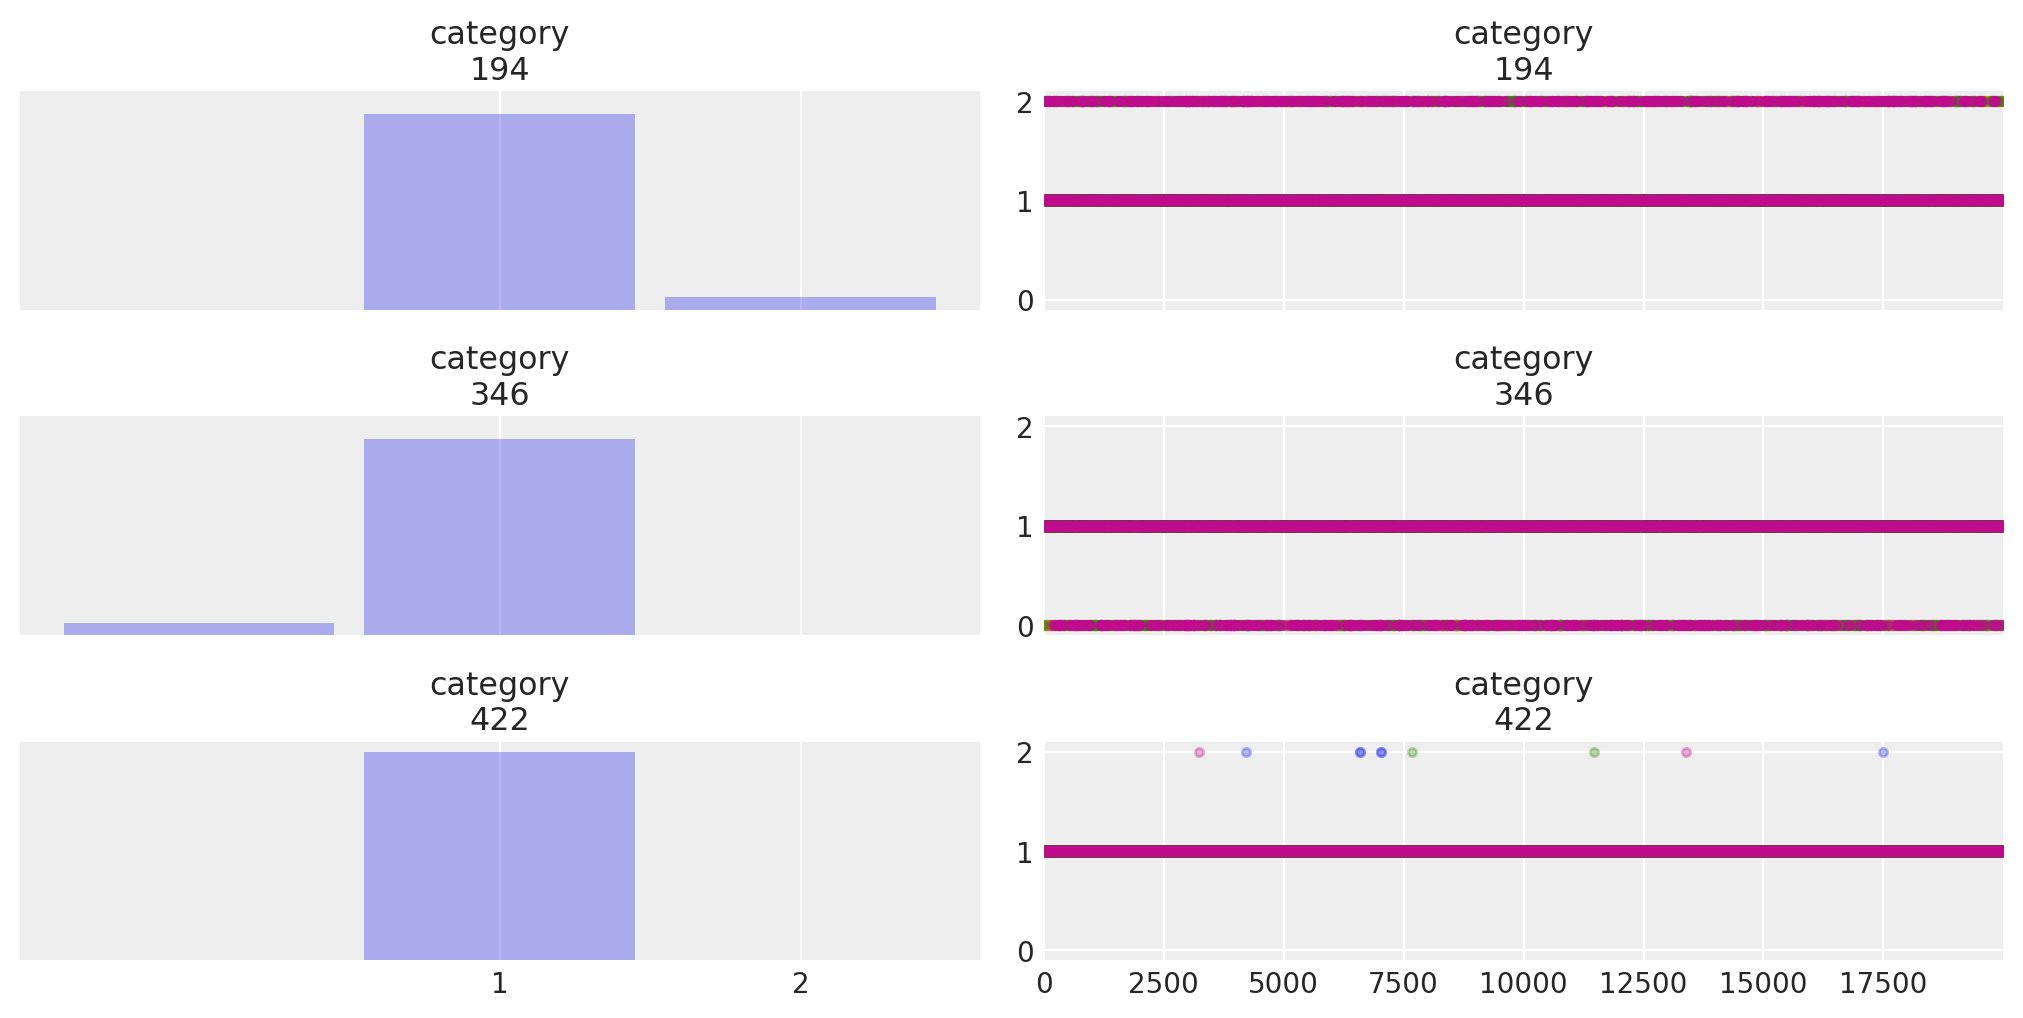
Sampling of cluster for individual data point
fig, axes = plt.subplots(3, 2, sharex="col", sharey="col", figsize=(10, 5))

az.plot_trace(
    trace,
    var_names="category",
    coords={"obs_id": [194, 346, 422]},
    compact=False,
    combined=True,
    trace_kwargs={"ls": "none", "marker": ".", "alpha": 0.3},
    axes=axes,
);
Original NB by Abe Flaxman, modified by Thomas Wiecki
Watermark
%load_ext watermark
%watermark -n -u -v -iv -w -p xarray
Last updated: Mon Sep 20 2021

Python implementation: CPython
Python version       : 3.8.10
IPython version      : 7.25.0

xarray: 0.17.0

numpy     : 1.21.0
pymc3     : 3.11.2
pandas    : 1.2.1
theano    : 1.1.2
matplotlib: 3.3.4
arviz     : 0.11.2

Watermark: 2.2.0
- PyMC Contributors . "Gaussian Mixture Model". In: PyMC Examples. Ed. by PyMC Team. DOI: 10.5281/zenodo.5832070